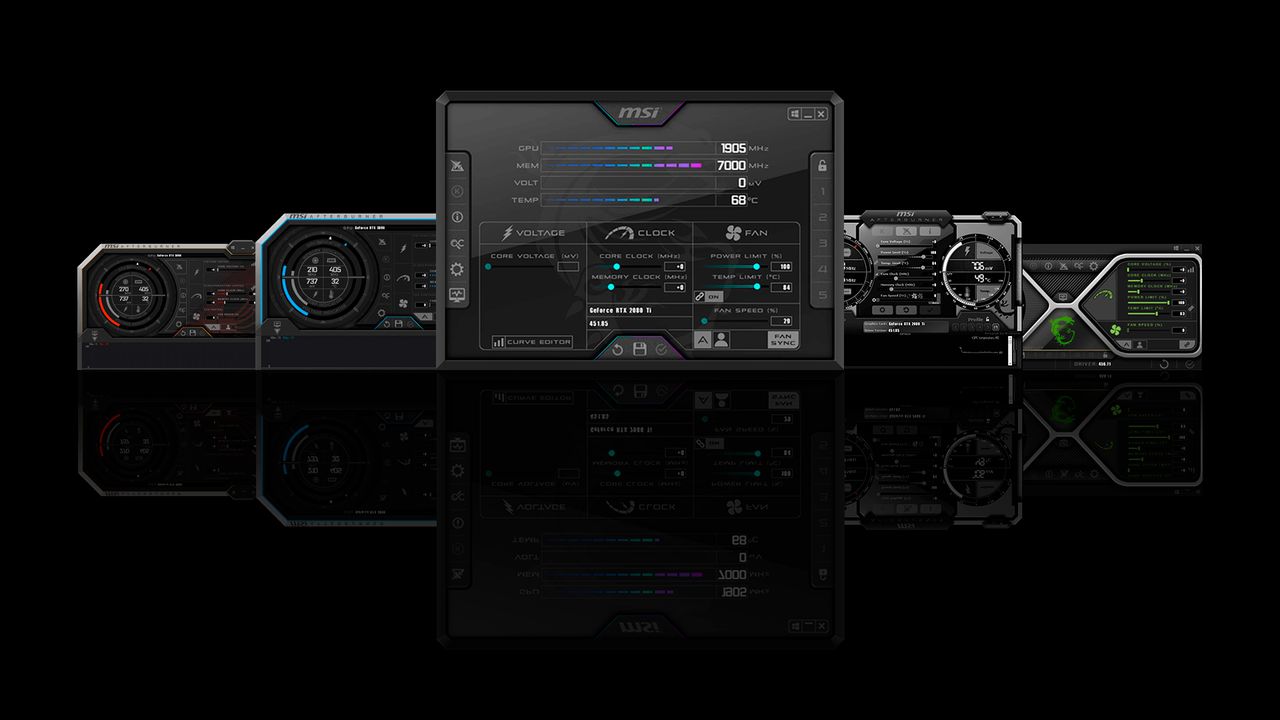
MSI Afterburner developer Unwinder is preparing a beta update that adds a heatmap to the tool’s voltage and frequency curve editor, giving overclockers a clearer view of where a GPU spends its time under real workloads.
Unwinder said on the Guru3D forums that the feature is planned for MSI Afterburner 4.6.7 beta 4. A final, non-beta release with the heatmap has not been announced. The current public beta cited in the discussion is 4.6.7 beta 3, build 17352, dated June 19.
The addition is aimed at a familiar overclocking problem: the V/F curve shows what a user configured, but it does not immediately show which voltage and clock points the GPU actually hits while gaming, idling, or running a heavy load. The new view overlays that behavior directly onto the existing curve editor.
How the heatmap works
According to Unwinder’s screenshots and explanation, Afterburner will mark frequently used voltage-frequency points with yellow dots inside the V/F curve chart. That lets a user compare the programmed boost curve against the points the card is choosing in practice.
In one example shared by Unwinder, an Nvidia GeForce RTX 5090 shows activity around 800 mV at 1200 MHz during idle or light-load behavior. Under heavier load, the same screenshot shows the card operating around 1000 mV to 1055 mV, with clocks roughly between 2.6 GHz and 2.8 GHz.
That is more useful than staring at a curve and pretending it tells the whole story. Modern GPUs constantly adjust voltage and frequency based on thermals, power limits, workload, and firmware behavior. The curve editor is the map. The heatmap is closer to the route the GPU actually took.
Blackwell appears to behave differently
Unwinder also used the feature to compare boosting behavior between Nvidia’s RTX 50-series cards and earlier GPUs. He attributed the difference to changes in Blackwell’s dynamic voltage frequency scaling, the mechanism that adjusts a GPU’s operating point on the fly.
A screenshot of an RTX 4090, according to Unwinder, showed heatmap dots concentrated near the low and high ends of the V/F curve. The RTX 5090 example showed dots spread across more of the curve, suggesting that the newer card spends more time in mid-range voltage and frequency states than the RTX 4090 in the demonstrated workload.
That comparison is a limited example, not a benchmark suite. It does show why the feature could be useful: if a card rarely touches parts of a curve, tuning those points may not help much. If it often lands in the middle of the curve, that region becomes more relevant for undervolting or overclocking work.
V/F curve tuning changes the relationship between voltage and clock speed used by the GPU’s boost algorithm. Enthusiasts often try to hold a given clock at lower voltage, then use the saved thermal or power headroom to push higher clocks elsewhere. Afterburner’s heatmap does not do that tuning for the user, but it should make the guesswork less theatrical.
This story draws on original reporting from Tom's Hardware.